Any developer working with ESP32 has most likely came across with one of those infamous “Guru Meditation Error” messages when the execution crashes. They look like this:
Basically, a cryptic output with a bunch of addresses that are begging to be decoded so one can even start make sense out of it! 😯 😥
It could be a limitation of mine, but I’ve struggled a long time with these messages and what to do with them. There must be a way to decode these, right?! After a long search I’ve found that such tool exists and it’s readily available in the IDF SDK. Surprisingly (again this could be my fault 😀 ) I haven’t seen it highlighted, let alone mentioned, in IDF documentation about debugging…
The tool goes by the (somewhat obvious) name of xtensa-esp32-elf-addr2line. It gets installed in the xtensa tools folder, along with the GCC compiler. There is one specific for each ESP32 series, so you have xtensa-esp32s2-elf-addr2line for ESP32-S2 and so on.
As inputs, the tool takes the executable file (in ELF format) and the backtrace information from the guru meditation error message. This bit here:
It also accepts various options to format the decoded output, which can be listed using the usual -h option that will output the help information.
For the sake of the example, this is the full command line that I’m using to decode the above back trace data:
And here’s the decoded output, which (out of curiosity) belongs to a nasty bug that we’ve chasing for a long time in .NET nanoFramework.
Now we have a nice stack trace with the call thread and, hopefully, a good starting point to start investigating what could be causing the fault.
VS Code Task for .NET nanoFramework
To make life easier for developers working in .NET nanoFramework a VS Code Task was added to the toolbox which makes decoding an ESP32 backtrace very easy.
Next step is to choose the ESP32 series (it defaults to ESP32).
Follows the path to the executable file to decode against. It defaults to the nanoCLR.elf that’s supposed to be found in the build directory after a successful build. In case the backtrace comes from a different executable, it’s a matter of replacing the default path with the full path to the respective file.
Last step is to enter the backtrace data coming from the guru meditation error output. Mind that only the backtrace line is required! Adding more than that won’t work.
The output with the stack trace shows in the console pane. Like this:
And this is it: simple and effective!
Now you can decode Guru Meditation Error messages from ESP32.
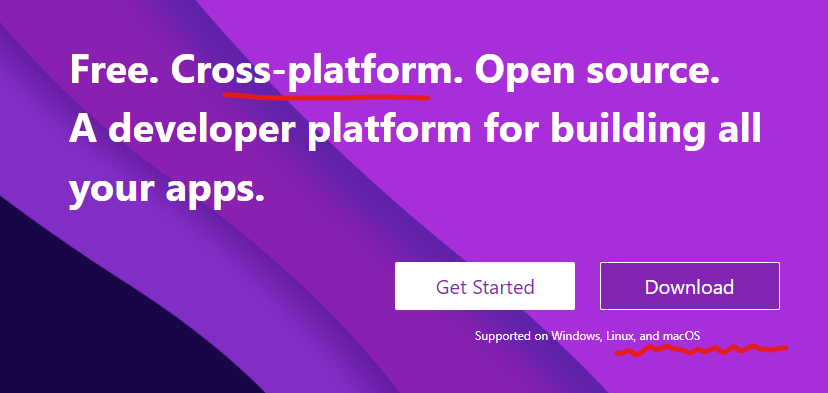
WOW! .NET it’s celebrating 20 years and that’s something!A bit of context so I’m not misinterpreted with what I’ll say next: I’ve been developing with .NET since 2005. Started with desktop applications, embraced embedded systems when .NETMF showed up, worked on several Azure technologies, Visual Studio extensibility, msbuild and other endeavors. Since 2016 I’ve been working relentlessly in .NET nanoFramework. I 💜 .NET and I use it for anything and everything that I can!The landing page for the celebration of 20 years of .NET it’s pretty neat and gives a perfect snapshot
of .NET history and also – if you can read between the lines – the general overview on how the .NET ecosystem is pictured by the “top levels”.
.NET it’s the ONLY ecosystem that allows coding from the most complex multi-node, distributed
cloud application down to blinking an LED on the tiniest micro-controller. Using exactly the same tools, the same language, the same technology and the same awesome experience from coding to debugging.
This is a fact that Scott Hanselman highlighted and completely demonstrated during the last .NET Conf in the session “.NET Everywhere – Windows, Linux, and Beyond”. So expressive and clear that just makes me want to repeat the above: .NET it’s the ONLY ecosystem where this is possible. (if you can prove me wrong, I’ll be happy to learn about it 🙂 )
Yet, the “small end” part keeps been treated as the stepchild of the .NET ecosystem…
For the life of me, I can not understand why!
On the landing page of the 20 years of .NET two pivotal moments are clearly missing :
And at the top right corner, that the sentence over there, should be something like this:
“Supported on Windows, Linux, macOS and microcontrollers.”
Yes, .NET can (also) run on Raspberry PIs and on tiny micro-controllers with just a few kilobytes of RAM and flash! And that should be shout out for everyone to know about it.
Until this is “fixed” and the “small end” of the .NET ecosystem is truly embraced and presented side by side, as an equal, just like the other tools and technologies there, we’ll keep failing on attracting even more developers, more students learning to code and more companies developing their products.
They’ll inevitably default to other technologies, by the simple fact that they don’t even know that this exists, that it is possible, ridiculously simple and that it can give them an immense productivity, efficiency, and joy. Or, to put it on other words, someone could be doing more on empowering every person and every organization on the planet to achieve more. 😉
Because those persons could and they would, if only they just knew…
Because .NET nanoFramework (usually) runs on single core processor there is no real parallel execution of multiple threads. There is a scheduler that allots a 20ms time slice to each thread in a round and robin fashion. If a thread is capable of running (meaning that is not blocked for any reason) it will execute for 20ms, after which the execution will resume on to the next “ready to run” thread and so on.
By default, a .NET program is started with a single thread, often called the primary thread. However, it can create additional threads to execute code in parallel or concurrently with the primary thread. These threads are often called worker threads.
Why use multiple threads?
Unlike a desktop or server application that can take advantage of running on a multiprocessor or multi-core system, .NET nanoFramework threads can be a very useful programming technique when you are dealing with several tasks that benefit from simultaneous execution or that need input from others. For example: waiting for a sensor to be read to perform a computation and decide on the action to take. Another example would be interacting with a device that requires pooling data constantly. Or a web service that is serving requests, there’s another typical example of multithreading use case.
How to use multithreading
You create a new thread by creating a new instance of the System.Threading.Thread class. There are a few ways of doing this.
Creating a thread object and passing in the instance method using a delegate. (note that the instance method can be either a static method or a method in a class already instantiated)
Thread instanceCaller = new Thread(
                new ThreadStart(serverObject.InstanceMethod));
After this the thread can be started with like this:
instanceCaller.Start();
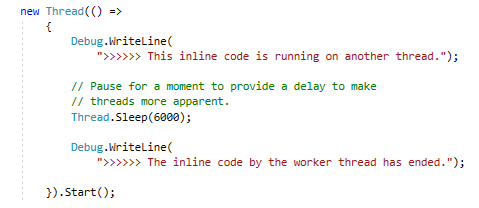
Another (and very cool!) way is to create a thread object using a lambda expression.
(note that this does not allow retaining a reference to the thread and the thread is started immediately.
new Thread(() =>
    {
        Debug.WriteLine(
            ">>>>>> This inline code is running on another thread.");

        // Pause for a moment to provide a delay to make
        // threads more apparent.
        Thread.Sleep(6000);

        Debug.WriteLine(
            ">>>>>> The inline code by the worker thread has ended.");

    }).Start();
Passing parameters
Occasionally it is required to pass parameters to a working thread. The simplest way of doing this is using a class to hold the parameters and have the thread method get the parameters from the class.
Something like this:
// Supply the state information required by the task.
ThreadWithState tws = new ThreadWithState(
    "This report displays the number", 42);

// Create a thread to execute the task, and then...

Thread t = new Thread(new ThreadStart(tws.ThreadProc));

// ...start the thread
t.Start();
Retrieving data from threads
Another common situation is the requirement of accessing data that results from a thread execution. Like a sensor reading that arrives upon a pooled access to a bus.
In this case setting up a call-back that gets executed by the thread before leaving it’s execution it’s a very convenient way of dealing with this.
// Supply the state information required by the task.
ThreadWithState tws = new ThreadWithState(
    "This report displays the number",
    42,
    new ExampleCallback(ResultCallback)
);

Thread t = new Thread(new ThreadStart(tws.ThreadProc));
t.Start();
Controlling threads execution
Threads execution can be controlled by means of the thread API that allows Starting, Suspending and Aborting a thread’s execution.
// create and start a thread
var sleepingThread1 = new Thread(RunIndefinitely);
sleepingThread1.Start();

Thread.Sleep(2000);

// suspend 1st thread
sleepingThread1.Suspend();

Thread.Sleep(1000);

// create and start 2nd thread
var sleepingThread2 = new Thread(RunIndefinitely);
sleepingThread2.Start();

Thread.Sleep(2000);

// abort 2nd thread
sleepingThread2.Abort();

// abort 1st thread
sleepingThread1.Abort();
Threads synchronization
A common scenario is to require a thread to wait for an external event before executing a block of code. To help these use cases there are two classes that block a thread execution until they are signalled elsewhere. ManualResetEvent requires that the code resets the event opposed to AutoResetEvent.
// ManualResetEvent is used to block and release threads manually. It // is created in the unsignaled state.
private static ManualResetEvent mre = new ManualResetEvent(false);

private static AutoResetEvent event_1 = new AutoResetEvent(true);
ivate static AutoResetEvent event_2 = new AutoResetEvent(false);
The API of both type of events it’s very flexible and convenient, allowing creating events already set or reset and have wait handlers waiting forever or for a specified timeout.
In multithread applications another common requirement is to manage access to shared resources, like a communication bus. In these situations, several threads that need to access the resource can only do it one at the time. For this there is the C# lock statement. Using it ensures that the code protected by it can only be accessed by one and only one thread. Any other thread that tries to execute that code block is put on hold until the thread executing it leaves that block.
All this is available out of the box from C# .NET base class library. Extremely easy to use and incredibly powerful. This empowers developers working on embedded systems to design and code multithreading applications with very little effort.
When debugging a multithreading application, developers can take advantage of the debugging capabilities of Visual Studio, examine execution of each thread, set breakpoints, check variables content, etc. All this without any special hardware or debugger configuration.
Samples for all the above scenarios are available in .NET nanoFramework samples repository. Make sure to clone it and use it to explore the API and it’s capabilities.
This came up following a conversation with a fellow developer about the use of Console.WriteLine() to output debug information and the fact that that output is useless in production code so it should be removed.
Basically, the conversation was around the removal of this call when the build was made in Release flavour. If it should be automatically handled by the compiler or if one has to use other means to deal with this, like wrapping with compiler defines.
I got curious about this and made my way to the .NET documentation website so this would not become another instance of RTFM. 😉
Risking stating the obvious for some, here are my findings about this, mostly for my personal future reference and shared here in case they are useful for anyone else.
According to the documentationConsole.WriteLine() – and friends – are meant to be used to write to the standard output stream of a console applications. This begs for a clarification about what exactly a “console” is… Again, from the documentation, a console “is an operating system window where users interact with the operating system”. In Windows OS, this is what we usually call the Command Prompt.
An interesting note on the documentation that caught my attention highlights this interesting bit: “do not use console class to display output in unattended applications”. I found it particularly interesting because of my involvement in nanoFramework. nanoFramework applications are undoubtedly (and by definition) unattended applications. So, technically, we have it wrong offering Console.WriteLine() in the API.
What is the alternative then? Let us dig deeper into .NET documentation.
The answer is the Debugger class. There we can find the equivalent WriteLine() method and friends. The description is abundantly clear: “use methods in the Debug class to print debugging information and check your logic with assertions”. Bingo!
Further reading uncovers the answer to what brought me here: “the ConditionalAttribute attribute is applied to the methods of Debug. Compilers that support ConditionalAttribute ignore calls to these methods unless DEBUG is defined as a conditional compilation symbol”.
Wow! That is exactly the behaviour that we were looking for. Out of the box. Using Debug.WriteLine() instead of Console.WriteLine() outputs debug information – as intended – but it also removes it from production code without any hassle.
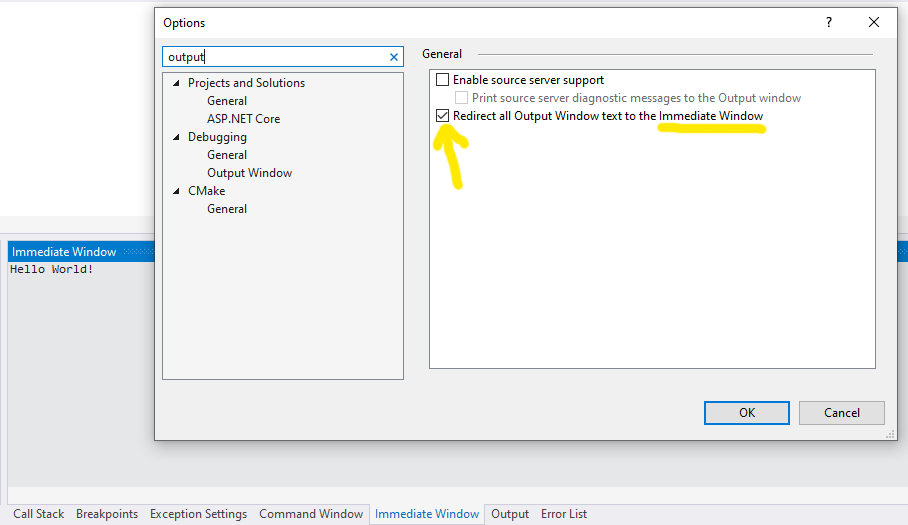
A final note to point out that the output can show on Visual Studio debug window or in Immediate window, depending on the setting exposed in the following option in Visual Studio.
This makes it perfectly clear that one should use Debug.WriteLine() to outout debug information to VS output window and keep Console.WriteLine() when the intention is indeed output to the console.
Taking this a step further, one can make use of the ConditionalAttribute to decorate methods that are meant only for debug. Something like this:
[System.Diagnostics.Conditional("DEBUG")]
public static void OutputDebugDetails (string message);
To deal with situations that require native coding or when one faces the situation of needing to add native code that has no place on the core library, there is Interop. It’s a rather powerful feature that opens immense possibilities.
Sending data from the native code to the C# managed application can be done easily by using either parameters passed by reference or sending the data on the return value. But… what if you need to signal your application of random events that occurs on the native code? Well now you can!
Let me explain how easy it is to use this cool feature. 😉
On your native code, all you have to do it’s just adding a simple line of code. Really! Like this:
PostManagedEvent( EVENT_CUSTOM, 0, 1111, 2222 );
The payload that’s available consists of the last two parameters on that call. The first it’s an uint16 and the second an uint32.
Feel free to use those as you please. This includes all possible variants like: use only the first one, or the second or none if you just need to signal something. Or, if you have a lot of events to process, you can encode those.
Have you ever faced the situation of needing to add support for a specific hardware? Or to perform some computing intensive task that would be more efficiently executed in C/C++ rather than with managed C# code?
This is possible with the support that .NET nanoFramework has to plug “code extensions”. It’s called Interop.
What exactly does this? Allows you to add C/C++ code (any code, really!) along with the correspondent C# API.
The C/C++ code of the Interop library is added to an nanoFramework image along with the rest of the nanoCLR.
As for the C# API: that one is compiled into a nice .NET nanoFramework library that you can reference in Visual Studio, just like you usually do.
The fact that this is treated as an extension of the core is intended and, in fact, very positive and convenient. A couple of reasons:
Doesn’t require any changes in the main core code (which can be broken or may prove difficult to merge with changes from the main repository).
Keeps your code completely isolated from the rest. Meaning that you can mange and change it as needed without breaking anyone’s stuff.
How cool is this? 🙂
For the purpose of this post we are going to create an Interop project that includes two features:
Hardware related: reads the serial number of the CPU (this will only work on ST parts).
Software only related: implementing a super complicated and secret algorithm to crunch a number.
Note: it’s presumed that you have properly setup your build environment and toolchain and are able to build a working nanoFramework image. If you don’t suggest that you take a look the documentation about it here and here.
Before we start coding there are a few aspects that you might want to consider before actually start the project.
Consider the naming of the namespace(s) and class(es) that you’ll be adding. Those should have meaningful names. You’ll see latter on that these names will be used by Visual Studio to generate code and other bits of the Interop project. If you start with something and keep changing it you might find yourself in trouble because your version control system will find diferences. Not to mention that other users of your Interop library (or even you) might start getting breaking changes in the API that you are providing them. (You don’t like when others do that to you, do you? So… be a pal and pay attention to this OK? 🙂 )
Creating the C# (managed) Library
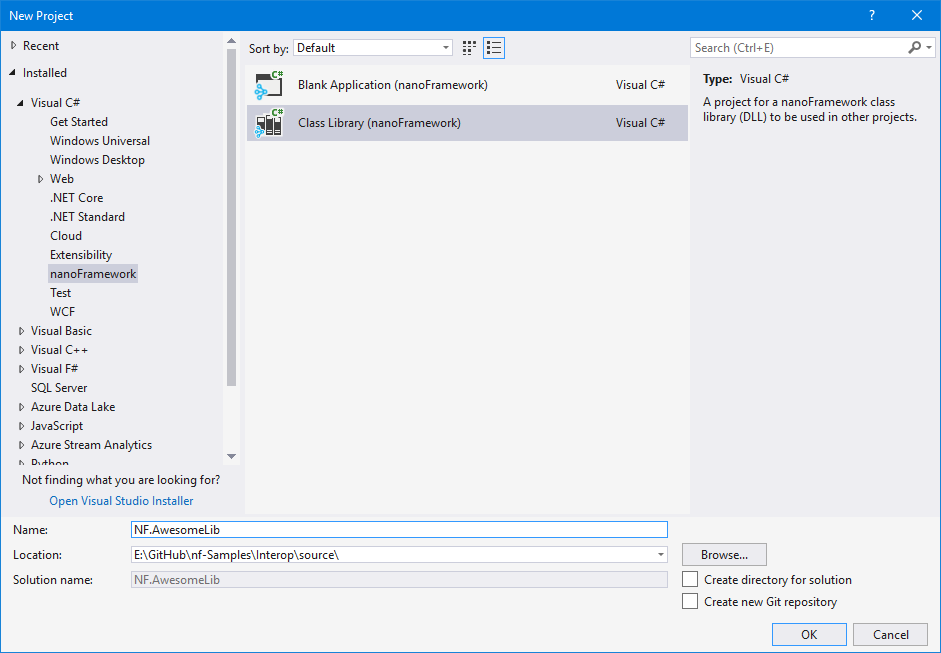
Create a new .NET nanoFramework project in Visual Studio
This is the very first step. Open Visual Studio, File, New Project.
Navigate to C# nanoFramework folder and select a Class Library project type.
For this example we’ll call the project “NF.AwesomeLib”.
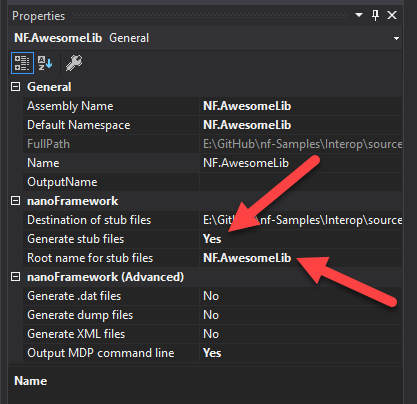
Go to the Project properties (click the project icon in the Solution explorer an go to the Properties Window) and navigate to the nanoFramework configuration properties view. Set the “Generate stub files” option to YES and the root name to NF.AwesomeLib.
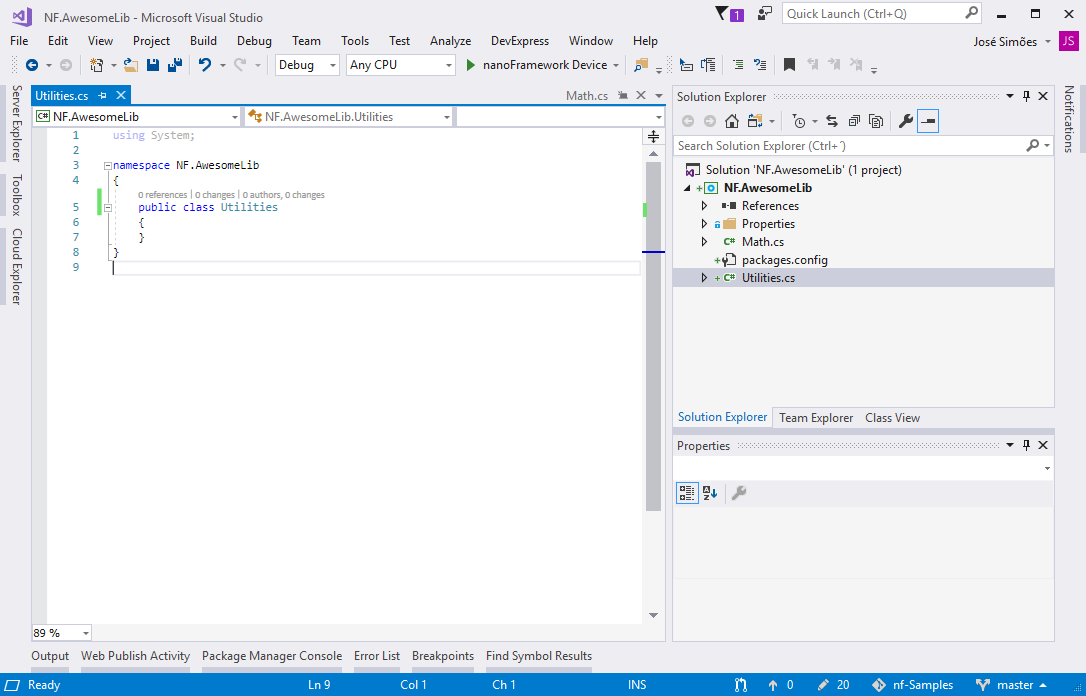
Now rename the Class1.cs that Visual Studio adds by default to Utilities.cs. Make sure that the class name inside that file gets renamed too. Add a new class named Math.cs. On both make sure that the class is public.
Your project should now look like this.
Adding the API methods and the stubs
The next step will be adding the methods and/or properties that you want to expose on the C# managed API. These are the ones that will be called on a C# project referring your Interop library.
We’ll add an HardwareSerial property to Utilities class and call to the native method that supports the API at the native end. Like this.
using System.Runtime.CompilerServices;

namespace NF.AwesomeLib
{
public class Utilities
{
private static byte[] _hardwareSerial;
///

/// Gets the hardware unique serial ID (12 bytes)
///

public static byte[] HardwareSerial
{
get
{
if (_hardwareSerial == null)
{
_hardwareSerial = new byte[12];
NativeGetHardwareSerial(_hardwareSerial);
}
return _hardwareSerial;
}
}

#region Stubs

[MethodImpl(MethodImplOptions.InternalCall)]
private static extern void NativeGetHardwareSerial(byte[] data);

#endregion stubs
}

}
A few explanations on the above:
The property HardwareSerial
has a only a getter because we are only reading the serial from the processor. As that can’t be written, it doesn’t make sense providing a setter, right?
The serial number is being stored in a backing field to be more efficient. When it’s read the first time it will go and read it from the processor. On subsequent accesses that won’t be necessary.
Note the summary comment on the property. Visual Studio uses that to generate an XML file that makes the awesome IntelliSense show that documentation on the projects referencing the library.
The serial number of the processor is handled as an array of bytes with length of 12. This was taken from the device manual.
A stub method must exist to enable Visual Studio to create the placeholder for the C/C++ code. So you need to have one for each stub that is required.
The stub methods must be implemented as extern and be decorated with the MethodImplAttribute attribute. Otherwise Visual Studio won’t be able to do it’s magic.
You may want to find a working system for you regarding the stub naming and where you place them in the class. Maybe you want to group them in a region, or you prefer to keep them along the caller method. It will work on any of those ways, just a hint on keep things organized.
Moving on to the Math class. We’ll now add an API method called SuperComplicatedCalculation and the respective stub. It will look like this:
using System.Runtime.CompilerServices;

namespace NF.AwesomeLib
{
public class Math
{
///

/// Crunches value through a super complicated and secret calculation algorithm .
///

/// Value to crunch.
///
public double SuperComplicatedCalculation(double value)
{
return NativeSuperComplicatedCalculation(value);
}

#region Stubs

[MethodImplAttribute(MethodImplOptions.InternalCall)]
private static extern double NativeSuperComplicatedCalculation(double value);

#endregion stubs
}
}
And this is all what’s required on the managed side. Build the project and look at the project folder using VS Code for example. This is how it looks like after a successful build:
From the top, you can see in the bin folder (debug or release flavor) the .NET library that should be referenced in other projects. Please note that besides the .dll file there is the .xml file (the one that will allow IntelliSense to it’s thing), the .pdb file and another one with a .pe extension.
When distributing the Interop library make sure that you supply all four files. Failing to do so will make Visual Studio complain that the project can’t build. You can add all those in a ZIP or even better, as a Nuget package.
Working on the C/C++ (native) code
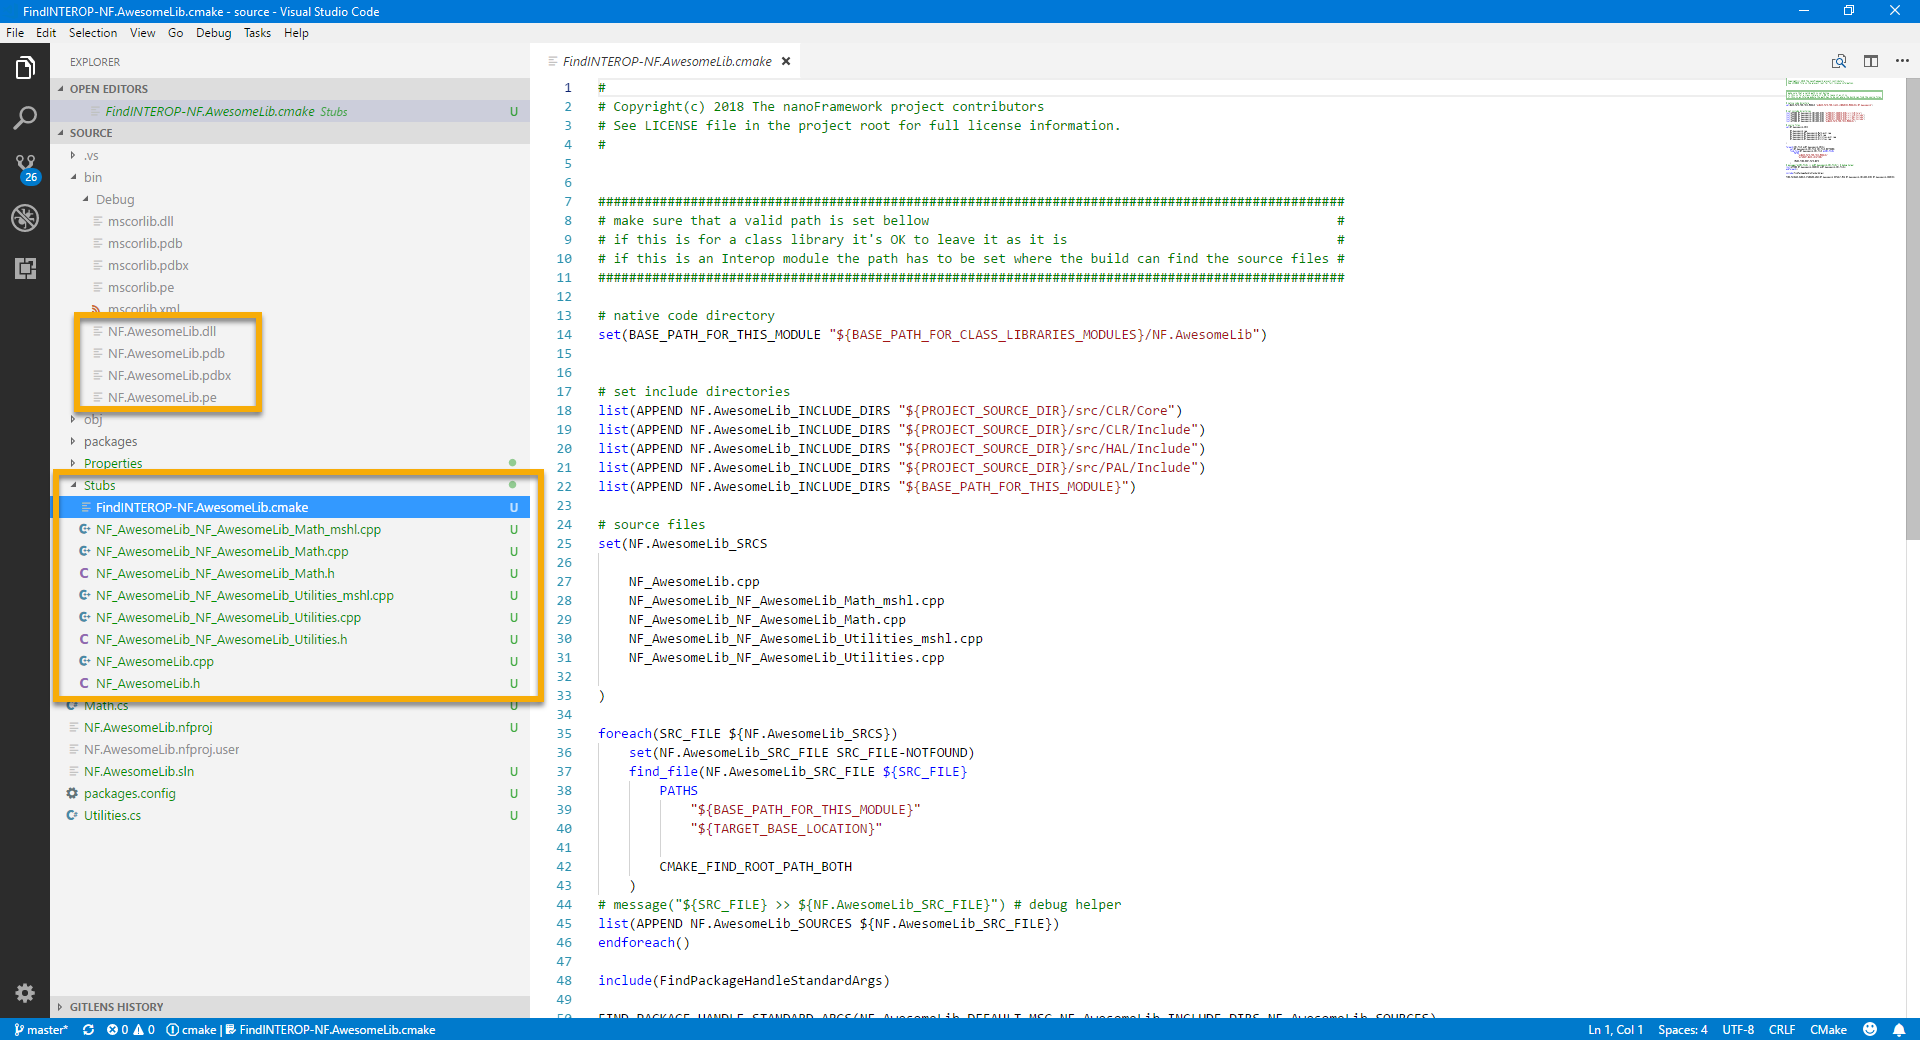
Moving to the Stubs folder we find a bunch of files and a .cmake file. All those are required when building the nanoCLR image that will add support for your Interop library.
Look at the file names: they follow the namespace and classes naming in the Visual Studio project.
Something very, very important: don’t even think on renaming or messing with the content of those files. If you do that you risk that the image build will fail or you can also end up with the Interop library not doing anything. This can be very frustrating and be very hard to debug. So, again, DO NOT mess around with those!
The only exception to that will be, of course, the ones that include the stubs for the C/C++ code that we need to add. Those are the .cpp files that end with the class name.
In our example those are: NF_AwesomeLib_NF_AwesomeLib_Math.cpp and
NF_AwesomeLib_NF_AwesomeLib_Utilities.cpp.
You’ve probably have noted that there are a couple of other files with a similar name but ending with _mshl. Those are to be left alone. Again DO NOTchange them.
Let’s look at the stub file for the Utilities class. That’s the one that will read the processor serial number.
This an empty C++ function named after the class and the stub method that you’ve placed in the C# project.
Let’s take a moment to understand what we have here.
The return value of the C++ function matches the type of the C# stub method. Which is void in this case.
The first argument has a type that is mapping between the C# type and the equivalent C++ type. A array of bytes in this case.
The last argument is an HRESULT type who’s purpose is to report the result of the code execution. We’ll get back to this so don’t worry about it for now. Just understand what’s the purpose of it.
According to the programming manual STM32F4 devices have a 96 bits (12 bytes) unique serial number that is stored starting at address 0x1FFF7A10. For STM32F7 that address is 0x1FF0F420. In other STM32 series the ID may be located in a different address. Now that we know were it is stored we can add code to read it. I’ll start with the code first and then walk through it.
The first if statement is a sanity check to be sure that there is enough room in the array to hold the serial number bytes. Why is this important?
Remember that here we are not in the C# world anymore where the CRL and Visual Studio take care of the hard stuff for us. In C++ things are very different! On this particular example if the caller wouldn’t have reserved the required 12 bytes in memory to hold the serial array, when writing onto there the 12 bytes from the serial could be overwriting something that is stored in the memory space ahead of the argument address. For types other than pointers such as bytes, integers and doubles this check is not required.
Still on the if statement you can see that, if there is not enough room we can’t continue. Before the code returns we are setting hr to CLR_E_BUFFER_TOO_SMALL (that’s the argument that holds the execution result, remember?). This is to signal that something went wrong and give some clue on what that might be. There is still more to say about this result argument, so we’ll get back to it.
In the next piece of code is were – finally – we are reading the serial from the device.
As the serial number is accessible in a memory address we can simply use a memcpy to copy it from its memory location to the argument.
A few comments about the argument type (CLR_RT_TypedArray_UINT8). It acts like a wrapper for the memory block that holds the array (or a pointer if you prefer). The class for that type provides a function – called GetBuffer() – that returns the actual pointer that allows direct access to it. We need that because we have to pass a pointer when calling memcpy. This may sound a bit complicated, I agree. If you have curiosity on the implementation details or want to know how it works I suggest that you delve into the nanoFrameworkrepo code and take a look at all this.
And that’s it! When this function returns the CPU serial number will be in the argument pointer and will eventually pop up in the C# managed code in that argument with the same name.
For the Math class there won’t be any calls to hardware or any other fancy stuff, just a complicated and secret calculation to illustrate the use of Interop for simple code execution.
Visual Studio has already generated a nice stub for us to fill in with code. Here’s the original stub:
Note that the stub function, again, matches the declaration of it’s C# managed counterpart and, again, has that hr argument to return the execution result.
Visual Studio was kind enough to add there the code for the return value so we can start coding on that. Actually that has to be exactly there otherwise this code wouldn’t even compile. 😉
Where is the super complicated and secret algorithm:
And with this we complete the “low level” implementation of our Interop library.
Adding the Interop library to a nanoCLR image
The last step that is missing is actually adding the Interop source code files to the build of a nanoCLR image.
You can place the code files pretty much anywhere you want it… the repo has a folder named Interop that you can use for exactly this: holding the folders of the Interop assemblies that you have. Any changes inside that folder won’t be picked up by Git.
To make it simple we’ll follow that and we just copy what is in the Stubs folder into a new folder InteropAssemblies\NF.AwesomeLib\.
The next file to get our attention is FindINTEROP-NF.AwesomeLib.cmake. nanoFramework uses CMake to generate the build files. Skipping the technical details suffice that you know that as far as CMake is concerned the Interop assembly is treated as a CMake module and, because of that, the file name to have it properly included in the build it has to be named FindINTEROP-NF.AwesomeLib.cmake and be placed inside the CMake\Modules folder.
Inside that file the only thing that requires your attention is the first statement where the location of the source code folder is declared.
If you are using the CMake Tools module to build inside VS Code you need to declare that you want this Interop assembly added to the build. Do so by opening the cmake-variants.json file and navigate to the settings for the image you want it added.
There you need to add the following CMake option (in case you don’t already have it there
"NF_INTEROP_ASSEMBLIES" : [ "NF.AwesomeLib" ],
A couple of notes about this:
The NF_INTEROP_ASSEMBLIES option expects a collection. This is because you can have as many Interop assemblies as you need to the nanoCLR image.
The name of the assembly must match exactly the class name. Dots included. If you screw up this you’ll notice it in the build.
In case you are calling CMake directly from the command prompt you have to add this option to the call like this
-DNF_INTEROP_ASSEMBLIES=["NF.AwesomeLib"]
It’s important to stress this: make sure you strictlyfollow the above.
Mistakes such as: failing to add the CMake find module file to the modules folder; having it named something else; having the sources files in a directory other that the one that was declared; will lead to errors or the library wont’ be included in the image. This will can lead very quickly to frustration. So, please, be very thorough with this part.
The following task is launching the image build. It’s assumed that you have properly setup your build/toolchain so go ahead and launch that build!
Fingers crossed that you wont’ get any errors… 😉
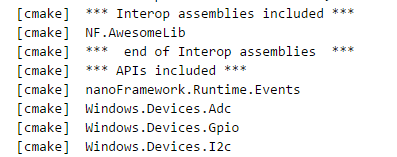
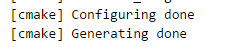
First check is on the CMake preparation output you should see the Interop library listed:
A successful CMake preparation stage (that include the Interop assembly as listed above) will end with:
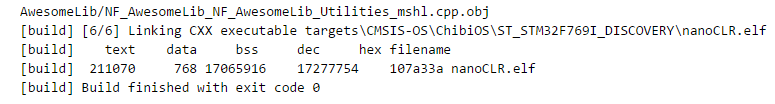
After the build completes successfully, you should be seeing something similar to this:
Reaching this step is truly exciting, isn’t it?! 🙂
Now go and load the image on a real board!
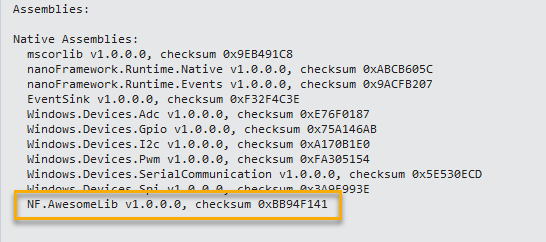
The next check after loading a target with the nanoCLR image that includes the Interop library is seeing it listed in the Native Assemblies listing. After booting the target is listed in Visual Studio Device Explorer list and after you click on the Device Capabilities button you’ll see it in the output window like this:
Congratulations, you did it! 😀 Let’s go now and start using the Interop library.
Using an Interop library
This works just like any other .NET library that you use everyday. In Visual Studio open the Add reference dialog and search for the NF.AwesomeLib.dll file that was the output result of building the Interop Project. You’ll find it in the bin folder. As you are going through that note the companion XML file with the same name. With that file there you’ll see the documentation comments showing in IntelliSense as you code.
This is the code to test the Interop library. On the first part we read the CPU serial number and output it as an hexadecimal formatted string. On the second we call the method that crunches the input value.
namespace TestInteropMFConsoleApplication
{
public class Program
{
public static void Main()
{
// testing cpu serial number
string serialNumber = "";

foreach (byte b in NF.AwesomeLib.Utilities.HardwareSerial)
{
serialNumber += b.ToString("X2");
}

Console.WriteLine("cpu serial number: " + serialNumber);

// test complicated calculation
NF.AwesomeLib.Math math = new NF.AwesomeLib.Math();
double result = math.SuperComplicatedCalculation(11.12);

Console.WriteLine("calculation result: " + result);
}
}
}
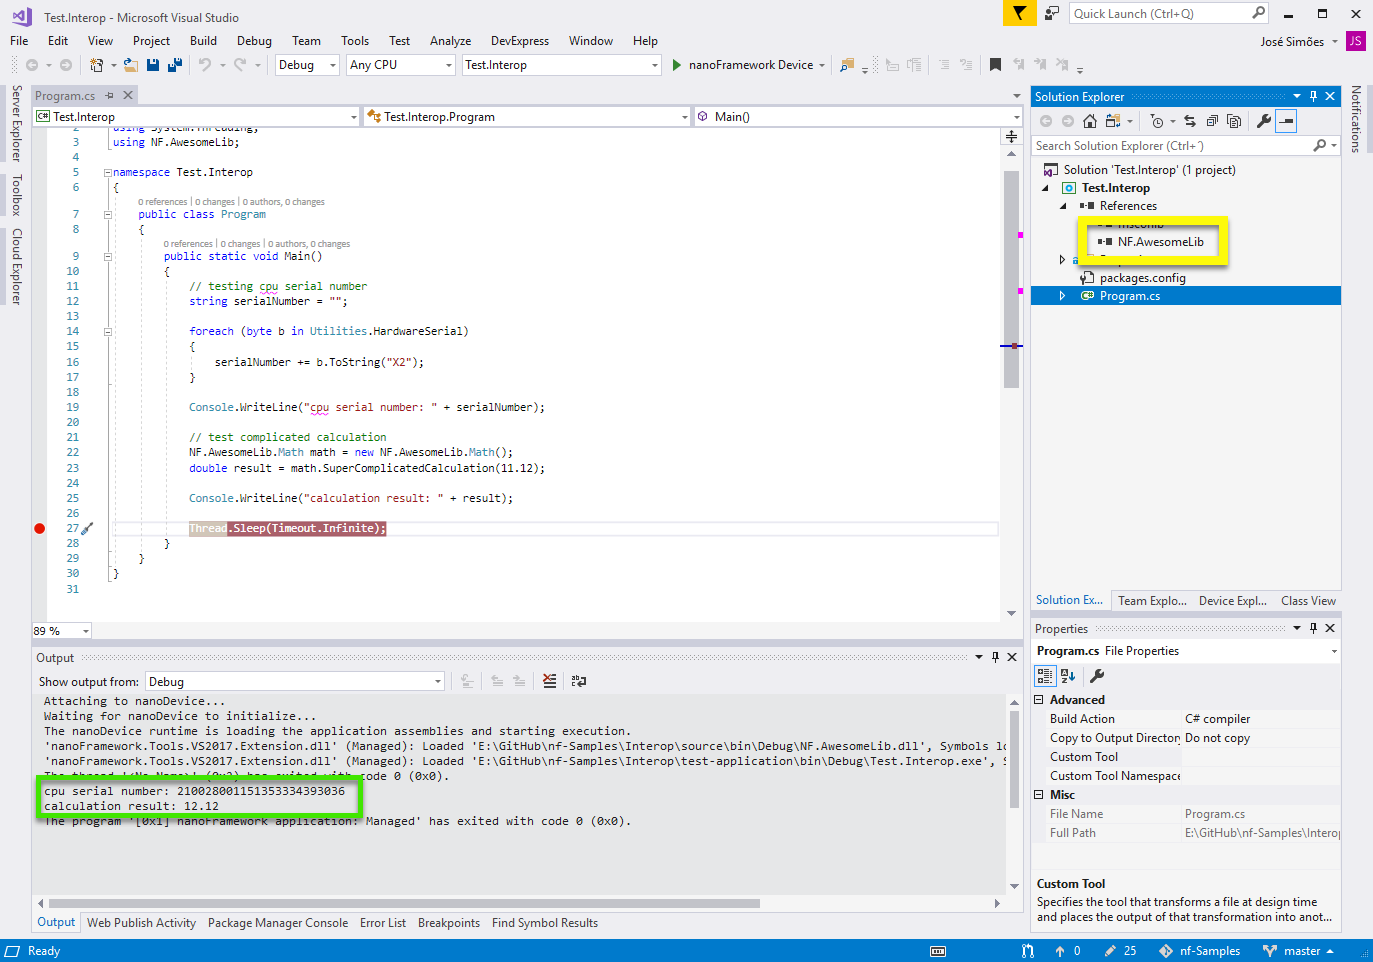
Here’s a screen shot of Visual Studio running the test app. Note the serial number and the calculation result in the Output window (in green). Also the DLL listed in the project references (in yellow).
Supported types in interop method calls
Except for strings, you’re free to use any of the standard types in the arguments of the Interop methods. It’s OK to use arrays of those too.
As for the return data, in case you need it, you are better using arguments passed by reference and update those in C/C++. Just know that arrays as returns types or by reference parameters are not supported.
Follows a table of the supported types and correspondence between platforms/languages.
CLR Type
C/C++ type
C/C++ Ref Type (C# ref)
C/C++ Array Type
System.Byte
uint8_t
UINT8*
CLR_RT_TypedArray_UINT8
System.UInt16
uint16_t
UINT16*
CLR_RT_TypedArray_UINT16
System.UInt32
uint32_t
UINT32*
CLR_RT_TypedArray_UINT32
System.UInt64
uint64_t
UINT64*
CLR_RT_TypedArray_UINT64
System.SByte
int8_t
Char*
CLR_RT_TypedArray_INT8
System.Int16
int16_t
INT16*
CLR_RT_TypedArray_INT16
System.Int32
int32_t
INT32*
CLR_RT_TypedArray_INT32
System.Int64
int64_t
INT64*
CLR_RT_TypedArray_INT64
System.Single
float
float*
CLR_RT_TypedArray_float
System.Double
double
double*
CLR_RT_TypedArray_double
Final notes
To wrap this up I would like to point out some hints and warnings that can help you further when dealing with this Interop library stuff.
Not all CLR types are supported as arguments or return values for the Interop stubs in the C# project. If the project doesn’t build and shows you an enigmatic error message, that’s probably the reason.
Every time the Interop C# project is build the stub files are generated again. Because of this you may want to keep on a separate location the ones that you’ve been adding code to. Using a version control system and a proper diff tool will help you merge any changes that are added because of changes in the C# code. Those can be renames, adding new methods, classes, etc.
When Visual Studio builds the Interop C# project a fingerprint of the library is calculated and included in the native code. You can check this in the NF_AwesomeLib.cpp file (in the stub folder). Look for the Assembly name and an hexadecimal number right bellow. This is what .NET nanoFramework uses to check if the native counterpart for that particular assembly is available in the device before it deploys an application. And when I say thatI mean it. If you change anything that might break the interface (such a method name or an argument) it will. On the “client” project Visual Studio will complain that the application can’t be deployed. Those changes include the project version in the C# Interop project too, so you can use this as you do with any project version number.
The hr (return parameter) is set to S_OK by default, so if nothing goes wrong in the code you don’t have to change it. When there are errors you can set it to an appropriate value that will surface in the C# as an exception. You may want to check the src\CLR\Include\nf_errors_exceptions.h file in the nanoFrameworkrepo.
Feel free to mix managed code to your C# Interop project too. If you have a piece of C# code that helps you achieve the library goal, just add it there. As long as it builds anything is valid either before or after the calls to the C/C++ stubs. If it helps and makes sense to be in the library, just add it there. You can even get crazy and call as many C/C++ stubs as you want inside a C# method.
And that’s all! You can find all the code related with this blog post in nanoFrameworksamples repo.
With all this I expect I was able to guide you through this very cool (and handy!) feature of .NET nanoFramework. Enjoy it!
Note: this post is a reviewed version of the original one published back in 2016. That post was about the now defunct .NETMF.
Being able to debug .NETMF native code is an absolute must for people working in the guts of the framework. Near the metal, at mcu register level very often.
This usually requires using expensive IDEs such as Keil uVision.
Those days are over!
Using the awesome Visual Studio Code you can now enjoy a full development experience without leaving the IDE. 😮 Yes, that is correct: from coding to debug. 🙂
Interested? Let’s take a look on how easy this is.
Requirements
Follows the requirement list that you need to have in place and properly setup.
To save you from troubles and wasting your time, here are a few things that you need to be careful about:
DON’T use spaces in the GCC and OpenOCD install paths.
DON’T use spaces in the GitHub repository path.
Follow STRICTLY the instructions in the Getting Started article at the .NETMF Wiki about the extra tools and the EXACT locations were they need to be.
A final requirement is that you have a debug device to actually connect to the mcu, such as the ST-LINK/V2. That, or a development board that includes an equivalent device. Most (if not all) ST’s Nucleo and Discovery boards do.
Make it all work from VS Code
Coding
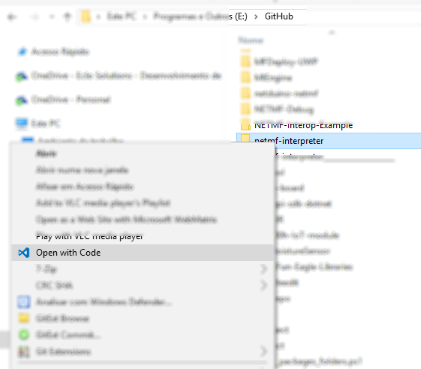
For all this to work as expected a basic requirement is that you open the .NETMF repo folder in VS Code. You can right click the folder and click in the Open with Code item that shows in the context menu. Like this.
I’ll just touch briefly the development part. VS Code is an excellent editor with a lot of nice and handy features that the we (the spoiled ones that work in Visual Studio) are used to, such as: “kind of” Intellisense, syntax colouring, navigation to functions and variable declaration and implementation.
Something worth noting is that there is no requirement on having a “formal project” with the code and include files properly setup, just like you’ll typically find in Visual Studio, Eclipse or uVision. What glues the code together for build purposes are the several ‘.proj’ files that live in the repository. This is makes it vey simple because you don’t need to add or remove ‘.c’ or ‘.h’ files as one is used to.
Launching the build
After coding, build is the next step in a typical development session. For this we’ll use VS Code Tasks.
When opening a folder in VS Code a new folder named ‘.vscode’ is automatically created. Inside this we have to add a file named ‘tasks.json’.
Here’s my tasks file with support to launch the build for all the Solutions in the current .NETMF repo.
{
    // See https://go.microsoft.com/fwlink/?LinkId=733558
    // for the documentation about the tasks.json format
    "version": "0.1.0",
    "command": "cmd",
    "args": ["/C"],
    "isShellCommand": true,
    "showOutput": "always",
    "tasks": [
        {
            "taskName": "Build STM32F4DISCOVERY",
            "suppressTaskName": true,
            "isBuildCommand": true,
            "args": ["${workspaceRoot}\\Solutions\\STM32F4DISCOVERY\\build_vscode.cmd"]
        },
        {
            "taskName": "Build STM32F429IDISCOVERY",
            "suppressTaskName": true,
            "isBuildCommand": true,
            "args": ["${workspaceRoot}\\Solutions\\STM32F429IDISCOVERY\\build_vscode.cmd"]
        },
        {
            "taskName": "Build MCBSTM32F400",
            "suppressTaskName": true,
            "isBuildCommand": true,
            "args": ["${workspaceRoot}\\Solutions\\MCBSTM32F400\\build_vscode.cmd"]
        }
    ]
}
Basically what we are doing here it setting up a task to launch the build for each of the available solutions. We’ll go into the details of the build script latter.
Now a nice touch to allow using the usual CTRL+SHIFT+B shortcut to launch the build for a particular solution.
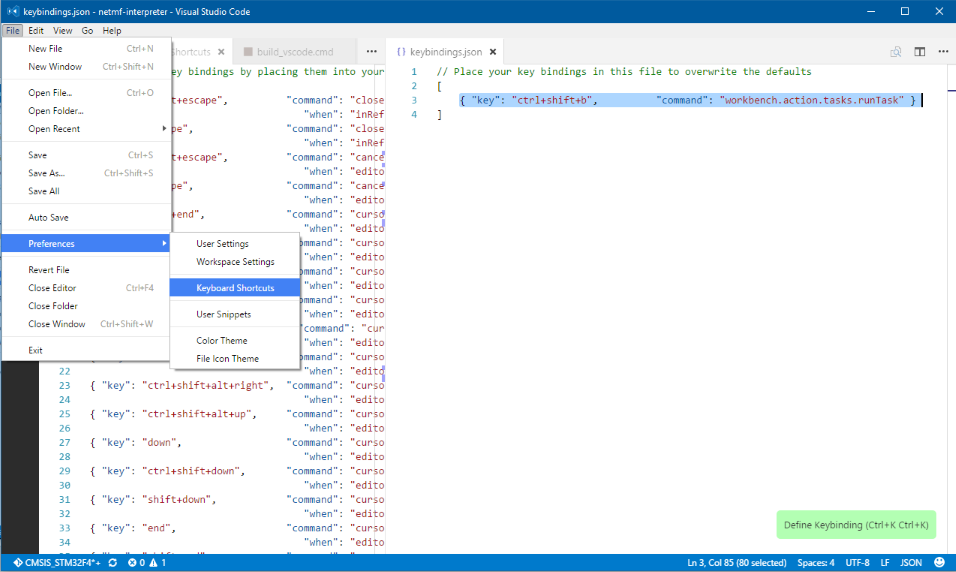
On VS Code go to menu File > Preferences > Keyboard Shortcuts. This will open the default keyboard shortcuts definition along with the user keybindings.json file on the right hand side. On this one you can add your keyboard shortcuts that override the default ones. For this particular purpose we want to override the default build shortcut with one that allows us to select a particular task, thus selecting the solution to build.
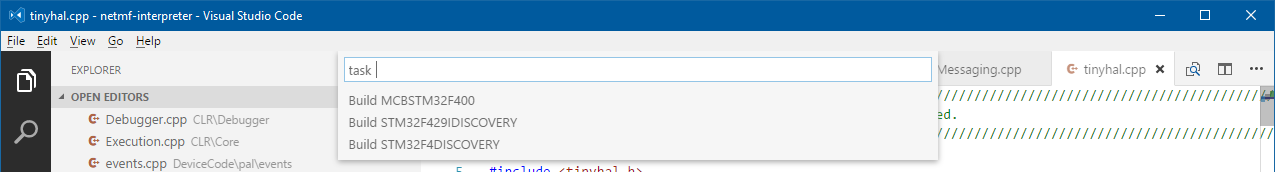
After this when you hit CTRL+SHIFT+B this is what you’ll get:
See there? All the tasks that are defined on the task.json file showing nicely so you can select which one you want to build.
To actually launch the build a command script is required. This won’t be anything fancy just a copy/paste from the various .NETMF build scripts that are available in the repo.
Open a new file at the Solution folder (for this example that will be \Solutions\STM32F4DISCOVERY) and name it build_vscode.cmd. Here’s the content:
setlocal
call setenv_gcc 5.4.1 "E:\GNU_Tools_ARM_Embedded\5_4_2016q3"
cd Solutions\STM32F4DISCOVERY
msbuild dotnetmf.proj /t:build /p:flavor=release;memory=flash /filelogger /flp:ErrorsOnly  /clp:verbosity=minimal /maxcpucount /v:m
@REM must rename the image file to include the HEX extension
cd..
cd..
cd BuildOutput\THUMB2FP\GCC5.4\le\FLASH\release\STM32F4DISCOVERY\bin\tinyclr.hex
rename ER_FLASH ER_FLASH.hex
endlocal&&exit /B %ERRORLEVEL%
Let’s take a look at what is there so you can tweak it to fit your needs.
On line 2 the setenv_gcc.cmd script is being called with the GCC version and path. Obviously you’ll need to set this to match your setup.
On the next line we change directory to the appropriate solution.
On line 4 we call msbuild with the several switches and options that we want. This one is for a build in release flavor with just the absolute minimum logging. This configuration performs a relatively quick build.
The next lines need to be there to rename the image file in order to include the .HEX extension, otherwise gbd won’t be able to use the file to program the flash.
Fell free to change this script to whatever suits your preferences.
Something very important that is missing in the current repo. The CPU needs to be properly configured to allow debug in the various low power modes. Failing to do so leads to all sorts of problems such as not being able to start the debug session because of communication problems with the device. To address this edit this file: DeviceCode\Targets\Native\STM32F4\DeviceCode\STM32F4_Power\STM32F4_Power_functions.cpp
and change CPU_Initialize() by adding this line right before the return statement:
BOOL CPU_Initialize()
{
    NATIVE_PROFILE_HAL_PROCESSOR_POWER();
    CPU_INTC_Initialize();

#if !defined(BUILD_RTM)
    // enable debug on any low power mode
    DBGMCU->CR |= DBGMCU_CR_DBG_SLEEP + DBGMCU_CR_DBG_STOP + DBGMCU_CR_DBG_STANDBY;
#endif

    return TRUE;
}
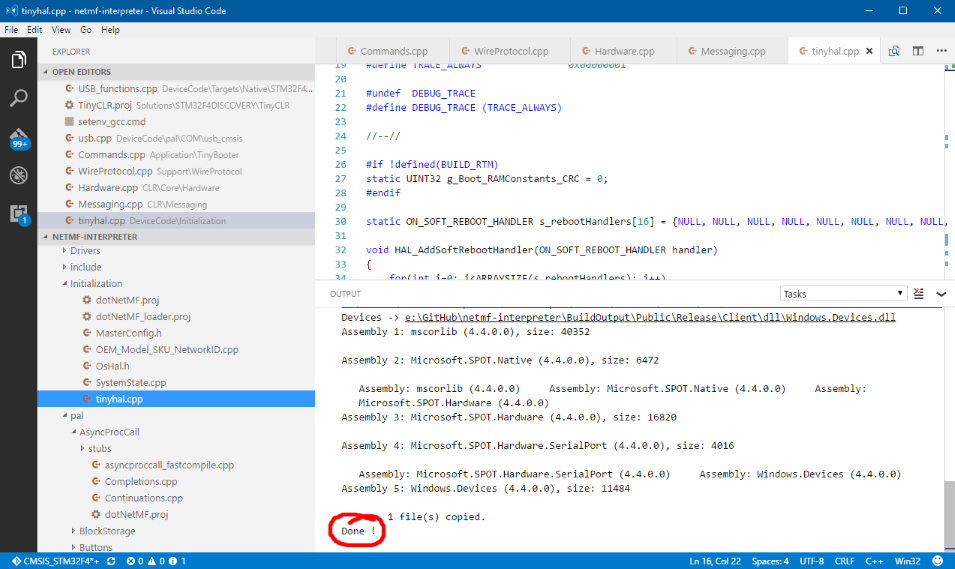
Now launch the build and you’ll see the output console showing with the progress messages displaying there. After a successful build (which can take some time, be warned!) this is what you can expect to see in the output console.
If, for some reason, the build fails you’ll see there the error message(s) and you should check the log files for details on what went wrong.
To have enough info in the compiled output for a decent debug session make sure you set the appropriate flavour to the build command. As an alternative you can always tweak the Microsoft.Spot.system.gcc.targets file. I’ve changed mine in these two lines:
Now that we have a .NETMF image we can move to the debugging step.
VS Code (through the C/C++ extension) knows how to interface with gdb, which in turn knows how to interface with the hardware through OpenOCD.
Going back to that .vscode folder we now have to add a new file named launch.json. This one takes care of setting up and launching the debug session. Follows the content.
Despite this might look a bit daunting, it’s not. Let me guide you through the various settings and options there so you can make it work for you.
miDebuggerPath: full path to the gdb executable (this one is inside the GCC toolchain folder) program: full path to the .axf output file that results from a successful NETMF build setupCommands (third ‘text’ entry): full path to the final image setupCommands (fourth ‘text’ entry): the same as the program above debugServerPath: full path to the OpenOCD executable debugServerArgs: full path to the scripts directory on the OpenOCD installation AND the appropriate .cfg files for the interface and the board.
In the launch.json file above I’ve added support for both the STM32F4DISCOVERY and the STM32F429IDISCOVERY solutions.
For both there is the stlink-v2-1.cfg for the interface.
The board support configuration is stm32f4discovery.cfg for the first and stm32f429discovery.cfg for the second.
Note the slash on all the paths there, the escaped double quotes and backslash. Be careful about these or the debug session won’t start.
When tweaking this to another interface or board just use the appropriate configuration file that is the respective OpenOCD directory.
We are ready to start that debug session now!
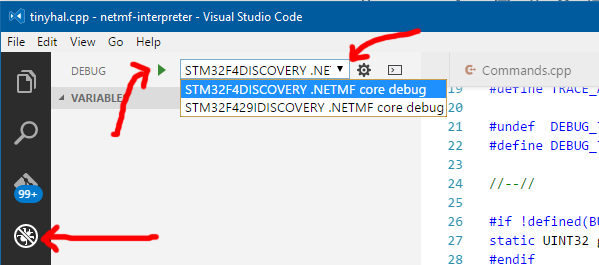
Using VS Code menu View > Debug, clicking on the debug icon on the left hand toolbar or hitting the CTRL+SHIT+D shortcut you’ll reach the debug view. There you’ll find the launch configurations for debug that we’ve setup above (see the drop down at the top) and the familiar green play button (or F5, if you prefer).
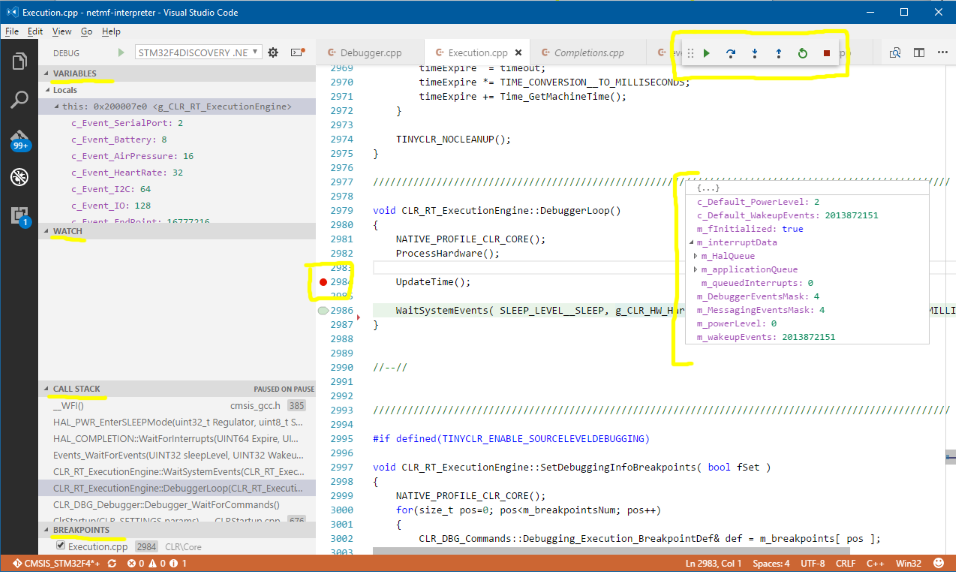
After starting the debug session the debug toolbar will popup.
When a debug session is active you can find a lot of familiar stuff:
debug toolbar with the usual operations (pause, step over, into, out, restart and stop)
variables list
call stack that you can use to navigate up and down
breakpoint list to manage those
watch expressions
support for ‘mouse over’ a variable which will display a context with the variable content
ability to set/remove breakpoints by clicking near the line number
other handy tools and options using the right click on the various objects
That’s rather complete isn’t it?
Wrapping up
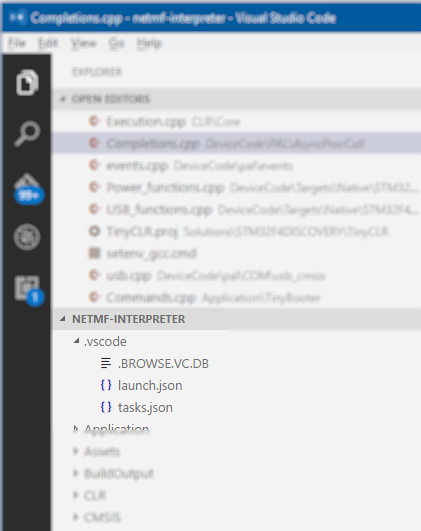
Just for visualizing how the configuration files end up, take a look on how the navigation tree looks like in the .NETMF repo in VS Code.
Kudos to the Visual Studio Code team for making it possible for .NETMF developers that work on the native code to have a full development experience by using such an awesome IDE packed with a lot of good stuff. 😀
If you care about the details on the tasks and launch files, feel free to go through all the documentation here:
This definitely opens new possibilities for .NETMF native development. What you are you waiting for? If you haven’t done so yet, fork the .NETMF repo on GitHub and start coding! The .NETMF community sure can use your help.
Note: I’ve submitted a pull request to the .NETMF GitHub with all the files and changes required to make this work. You may want to grab the files from there until it’s merged.
Have you ever faced the situation of needing to add support for a specific hardware? Or to perform some computing intensive task that would be more efficiently executed in C/C++ rather than with managed C# code?
This is possible with the support that .NETMF has to plug “code extensions”. It’s called Interop.
What exactly does this? Allows you to add C/C++ code (any code) along with the correspondent C# API.
The C/C++ code is added to an image along with the rest of the CLR and other stuff that gets loaded in the flash. The C# API is compiled into a nice .NET library that you can reference in Visual Studio, just like any other.
The fact that this is treated as an extension of the core is intended and, in fact, very positive and convenient. A couple of reasons:
Doesn’t require any changes in the main core code (which can be broken or may prove difficult to merge with changes from the main repository).
Keeps your code completely isolated from the rest. Meaning that you can mange and change it as needed without breaking anyone’s stuff.
How cool is this? 🙂
For the purpose of this post we are going to create an Interop project that includes two features:
Hardware related: read the serial number of the processor (this will only work on ST parts).
Software only related: implementing a super complicated and secret algorithm to crunch a number.
Note: it’s assumed that you have properly setup your build/toolchain and are able to build a loadable and working image of .NETMF.
Some aspects that you might want to consider before actually start the project.
A word of caution: consider the naming of the namespace(s) and class(es) that you’ll be adding. Those should have meaningful names. You’ll see latter on that these names will be used by Visual Studio to generate code and other bits of the Interop project. If you start with something and keep changing it you might find yourself in trouble because your version control system will find diferences. Not to mention that other users of your Interop library (or even you) might start seeing breaking changes in the API that you are providing them. (You don’t like when others do that to you, do you? So… be a pal and pay attention to this OK? 🙂 )
Create a new .NETMF project in Visual Studio
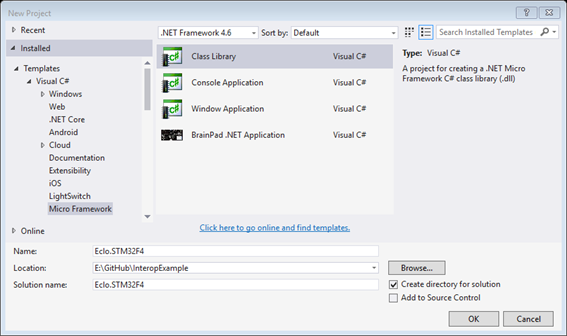
This is the very first step. Open Visual Studio, File, New Project.
Navigate to C# Micro Framework and select a Class Library project type.
For this example we’ll call the project “Eclo.STM32F4”.
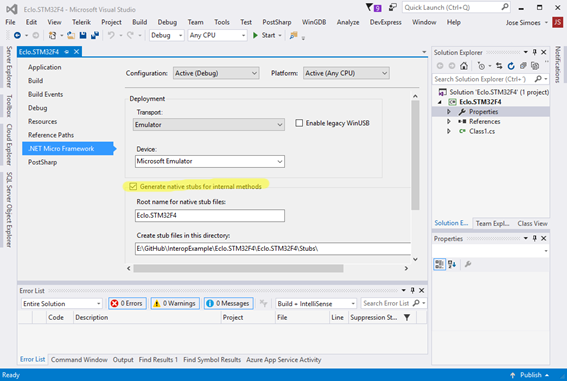
Open the Project properties and navigate to the .NET Micro Framework tab.
Enable the “Generate native stubs for internal methods” option.
Now rename the Class1.cs that Visual Studio adds by default to Utilities.cs. Make sure that the class name inside that file gets renamed too. Add a new class named Math.cs.
On both make sure that the class is public.
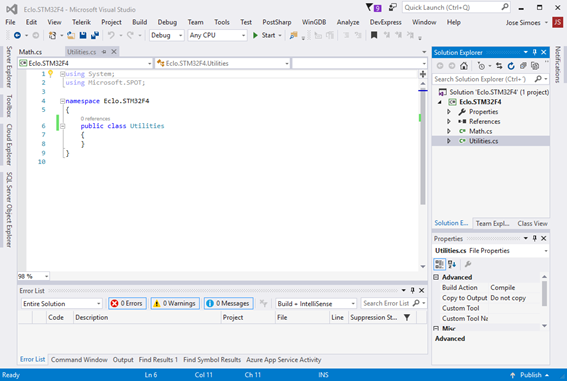
Your project should now look like this.
Adding the API methods and the stubs
The next step will be adding the methods and/or properties that you want to expose on the C# managed API. These are the ones that will be called on a C# project referring your Interop library.
We’ll add an HardwareSerial property to Utilities class. Like this.
using System.Runtime.CompilerServices;

namespace Eclo.STM32F4
{
    public class Utilities
    {
        private static byte[] _hardwareSerial;
        ///
<summary>
        /// Gets the hardware unique serial ID (12 bytes)
        /// </summary>

        public static byte[] HardwareSerial
        {
            get
            {
                if (_hardwareSerial == null)
                {
                    _hardwareSerial = new byte[12];
                    NativeGetHardwareSerial(_hardwareSerial);
                }
                return _hardwareSerial;
            }
        }

        #region Stubs

        [MethodImplAttribute(MethodImplOptions.InternalCall)]
        private static extern void NativeGetHardwareSerial(byte[] data);

        #endregion stubs
    }

}
Some explanations on the above:
This property has a only a getter because we are only reading the serial from the processor. We can’t write it, so it wouldn’t make sense providing a setter.
We are storing the serial number in a backing field to be more efficient. When it’s read the first time it will go and read it from the processor. On subsequent accesses that won’t be necessary.
Note the summary comment on the property. Visual Studio uses that to generate an XML file that makes the awesome IntelliSense show that documentation on the projects referencing the library. For this to happen you have to enable the option “XML documentation file” that is in the project properties under the Build tab.
The serial number of the processor is handled as an array of bytes with length of 12. This was taken from the device manual.
A stub method must exist to enable Visual Studio to create the placeholder for the C/C++ code. So you need to have one for each stub that is required.
The stub methods must be implemented as extern and be decorated with the MethodImplAttribute attribute. Otherwise Visual Studio won’t be able to do it’s magic.
You may want to find a working system for you regarding the stub naming and where you place them in the class. Maybe you want to group them in a region, or you prefer to keep them along the caller method. It will work anyway but it sure helps to have things organized.
Moving on to the Math class. We’ll now add an API method called SuperComplicatedCalculation and the respective stub. It will look like this:
using System.Runtime.CompilerServices;

namespace Eclo.STM32F4
{
    public class Math
    {
        ///
<summary>
        /// Crunches value through a super complicated and secret calculation algorithm .
        /// </summary>

        /// Value to crunch.
        ///
        public double SuperComplicatedCalculation(double value)
        {
            return NativeSuperComplicatedCalculation(value);
        }

        #region Stubs

        [MethodImplAttribute(MethodImplOptions.InternalCall)]
        private static extern double NativeSuperComplicatedCalculation(double value);

        #endregion stubs
    }
}
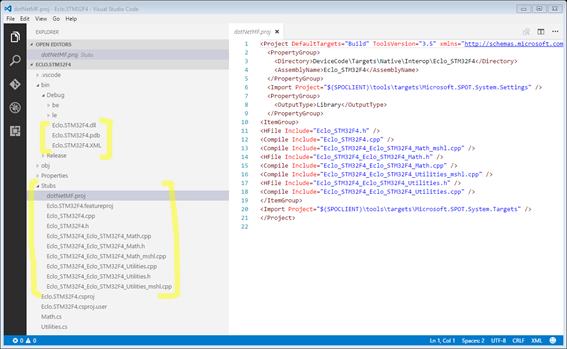
And this is all what’s required on the managed side. Build the project and Visual Studio will output the following:
On the bin folder (debug or release) there is the .NET library that is referenced in other projects. Please note that besides the .dll file there is the .xml file (the one that will allow IntelliSense to it’s thing) and two other folders be and le. Those stand for Big Endian and Little Endian. This allows Visual Studio to build the managed project for any of those processor flavours. When distributing the Interop library make sure that you supply allthe contents of the debug or release folder. Inner folders included. Failing to do so will make Visual Studio complain that the project can’t build. My suggestion is that you ZIP the folder so nothing will be missing.
Working on the C/C++ (native) code
Moving to the Stubs folder we find a bunch of files and a dotnet.proj file. All those are required when building the .NETMF image that will add your Interop library. Look at the file names: they follow the namespace and classes naming.
Something very, very important: don’t even think on renaming or messing with the content of those files. If you do it you risk that the image build will fail or you can also end up with the Interop library not doing anything. This can be very frustrating and be very hard to debug. So, again, DO NOT mess around with those!
The only exception to that will be, of course, the ones that include the placeholders for the C/C++ code that we need to add. Those are the .cpp files that end with the class name.
In our example those are: Eclo_STM32F4_Eclo_STM32F4_Math.cpp and Eclo_STM32F4_Eclo_STM32F4_Utilities.cpp.
Notice that there are files with a similar name but end with _mshl. Those are to be left alone. DO NOT change them.
Let’s look at the stub file for the Utilities class. That’s the one that will read the processor serial number.
That’s an empty C++ function named after the class and the stub method that are in the C# project.
Let’s take a moment to understand what we have here.
The return value of the C++ function matches the type of the C# stub method. Which is void in this case.
The first argument has a type that is mapping between the C# type and the equivalent C++ type. A array of bytes in this case.
The last argument is an HRESULT type who’s purpose is to report the result of the code execution. We’ll get back to this so don’t worry about it for now. Just understand what’s the purpose of it.
According to the manual devices of STM32F4 series have a 96 bits (12 bytes) unique serial number that is stored starting at address 0x1FFF7A10. In other STM32 series, this ID may be located in a different address. Now that we know were it is stored we can add code to read it. I’ll start with the code first and then walk you through it.
The first if statement is a sanity check to be sure that there is enough room in the array to hold the serial number bytes. Why is this important?
Remember that we are not in the C# world anymore where the CRL and Visual Studio take care of the hard stuff for us. In C++ things are very different! On this particular example if the caller wouldn’t have reserved the required 12 bytes in memory to hold the serial array, when writing there the 12 bytes from the serial could be overwriting something that might be stored in the memory space ahead of the argument address. For types other than pointers such as bytes , integers and doubles this check is not required.
Still on the if statement you can see that, if there is not enough room we can’t continue. Before the code returns we are setting hr (that’s the argument that holds the execution result, remember?) to CLR_E_BUFFER_TOO_SMALL to signal that something went wrong and give some clue on what that might be. There is still more to say about this result argument, so we’ll get back to it.
In the next piece of code is were – finally – we are reading the serial from the device.
As the serial is accessible in a memory address we can simply use a memcpy to copy it from its memory location to the argument.
A few comments about the argument type (CLR_RT_TypedArray_UINT8). It acts like a wrapper for the memory block that holds the array (or a pointer if you prefer). The class for that type provides a function – called GetBuffer() – that returns the actual pointer that allows direct access to it. We need that because we have to pass a pointer when calling memcpy. This may sound a bit complicated, I agree. If you have curiosity on the implementation details or want to know how it works I suggest that you delve into the .NETMF repo code and take a look at all this.
And that’s it! When this function returns the device serial will be in the argument and will eventually pop up in the C# managed code in that argument with the same name.
For the Math class there won’t be any calls to hardware or any other fancy stuff, just a complicated and secret calculation to illustrate the use of Interop for simple code execution.
Visual Studio has already generated a nice stub for us to fill in with code. Here’s the original stub:
Note that the stub function, again, matches the declaration of it’s C# managed counterpart and, again, has that hr argument to return the execution result.
Visual Studio was kind enough to add there the code for the return value so we can start coding on that. Actually that has to be there otherwise this code wouldn’t even compile. 😉
Where is the super complicated and secret algorithm:
And with this we complete the “low level” implementation of our Interop library.
Adding the Interop library to a Solution
The last step that is missing is actually adding the Interop to a Solution so it gets incorporated in a usable .NETMF image.
The auto-generated code expects that the code for an Interop library is placed in the path DeviceCode\Targets\Native\Interop\ followed by the namespace. You can follow that suggestion or choose another location. If you change that you’ll have to edit the project files accordingly.
To make it simple will follow that and will copy what in the Stubs folder into a new folder at \DeviceCode\Targets\Native\Interop\Eclo_STM32F4\.
The file Eclo.STM32F4.featureproj requires some changes. Here is the original file.
Add a description in line 6 (just to make it look nice, not that is mandatory)
At line 13 (the one starting with MMP_DAT_CreateDatabase) change the path to point to the bin folder of the managed project. For this example and with my current file tree it will be something like this:
<MMP_DAT_CreateDatabase Include=”E:\GitHub\NETMF-Interop-Example\Eclo.STM32F4\Eclo.STM32F4\bin\Debug\$(ENDIANNESS)\Eclo.STM32F4.pe” />
(mind the exact location of the build output of the Interop project)
Correct the path for the dotnet.proj file in line 14 to match the location of the Interop project. That will become something similar to:
$(SPOCLIENT)\DeviceCode\Targets\Native\Interop\Eclo_STM32F4\dotnetmf.proj
Quite obvious, I think, so no explanations need here. Save the file and you’re done with this.
For the sake of this example we’ll be adding this Interop library to the Discovery4 solution that is in the .NETMF repo. Navigate to the Discovery4 solution folder, more precisely to the TinyCLR folder. Now open the TinyCLR.proj file.
Make the following changes and check a couple of others:
Look for a bunch of Import adding featureproj to the solution. As it is today, after line 65, insert this:
Make sure that after all those Imports (when I say after, it has to be the very last of them) the following line is there (that would be after line 67):
At the end of the project file you’ll find an Import for Microsoft.SPOT.System.Targets. Right before that one add this block that will be the last ItemGroup of the proj file:
I have to stress this: make sure you strictlyfollow the above.
Mistakes such as: failing to add the featureproj at the correct location; not having the import for the Interop.Settings or having it at the wrong order; missing the ItemGroup for the native code will lead to errors or the library wont’ be included in the image. This will can lead very quickly to frustration. So, please, be very thorough with this part.
The following task is launching the image build. It’s assumed that you have properly setup your build/toolchain so go ahead and launch that build!
Fingers crossed that you wont’ got any errors… 😉
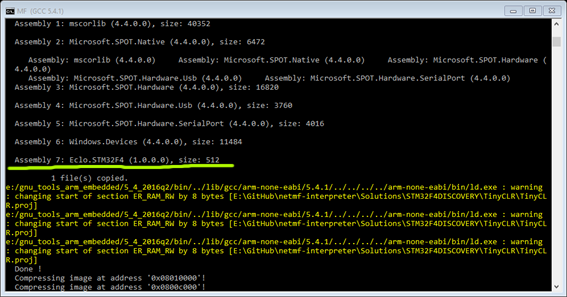
First check: on the msbuild output you should see the Interop library showing.
Reaching this step is truly exciting, isn’t it?! 🙂
Now go and load the image on a real board!
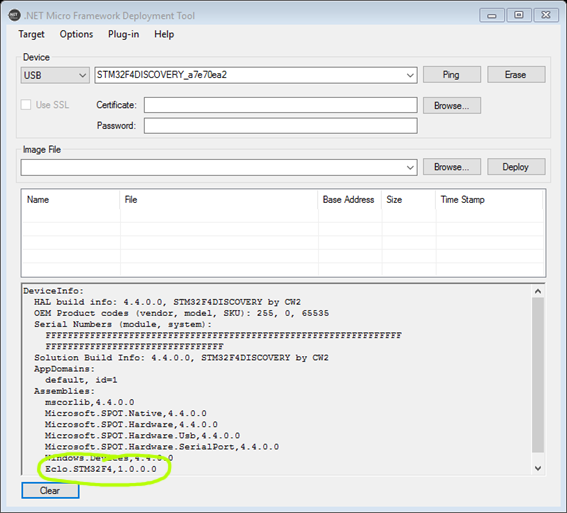
Next check: after a successful boot you should be able to see your board on the good old MFDeploy. On the menu go to Plug-in, Debug, Show Device Info. You should see the sucker again there.
Congratulations, you did it! Let’s go now and start using the Interop library.
Using an Interop library
This works just like any other .NET library that you use everyday. In Visual Studio open the Add reference dialog and search for the Eclo.STM32F4.dll file that’s the output result of building the Interop Project. You’ll find it in the bin folder. As you are going through that note the companion XML file with the same name. With that file there you’ll see the documentation comments showing in IntelliSense as you code.
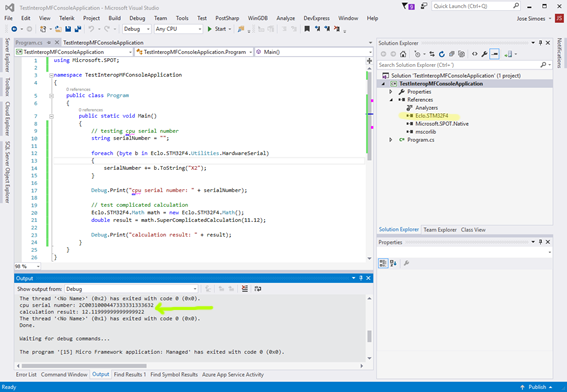
This is the code to test the Interop library. On the first part we read the CPU serial number and output it as an hexadecimal formatted string. On the second we call the method that crunches the input value.
using Microsoft.SPOT;

namespace TestInteropMFConsoleApplication
{
    public class Program
    {
        public static void Main()
        {
            // testing cpu serial number
            string serialNumber = "";

            foreach (byte b in Eclo.STM32F4.Utilities.HardwareSerial)
            {
                serialNumber += b.ToString("X2");
            }

            Debug.Print("cpu serial number: " + serialNumber);

            // test complicated calculation
            Eclo.STM32F4.Math math = new Eclo.STM32F4.Math();
            double result = math.SuperComplicatedCalculation(11.12);

            Debug.Print("calculation result: " + result);
        }
    }
}
Here is a screen shot of Visual Studio running the test code. Note the serial number and the calculation result in the Output window (in green). Also the DLL in the project references (in yellow).
Final notes
To wrap this up I would like to point out some hints and warnings that can help you further when dealing with this Interop library stuff.
Not all CLR types are supported as arguments or return values for the Interop stubs in the C# project. If the project doesn’t build and shows you an enigmatic error message, that’s probably the reason. (I’ll be adding a list of the supported types in the GitHub repo with the code for this example.)
Every time the Interop C# project is build the Stub files are generated again. Because of this you may want to keep on a separate location the ones that you’ve been adding code to. Using a version control system and a proper diff tool will help you merge any changes that are added because of changes in the C# code. Those can be renames, adding new methods, classes, etc.
When Visual Studio builds the Interop C# project a fingerprint of the library is calculated and included in the native code. You can check this in the Eclo_STM32F4.cpp file (in the stub folder). Look for the Assembly name and an hexadecimal number right bellow. This is what .NETMF uses to check if that particular assembly is in the device when it’s deploying the application. And when I say particular I mean it. If you change anything that might break the interface (such a method name or an argument) it will. On the “client” project Visual Studio will complain that the application can’t be deployed. Those changes include the project version in the C# Interop project too, so you can use this as you do with any project version number.
The hr (return parameter) is set to S_OK by default, so if nothing goes wrong in the code you don’t have to change it. When there are errors you can set it to an appropriate value that will surface in the C# as an exception. You may want to check the DeviceCode/include/netmf_errors.h file in the .NETMF repo.
Feel free to mix managed code to your C# Interop project too. If you have a piece of C# code that helps you achieve the library goal, just add it there. As long as it builds anything is valid either before or after the calls to the C/C++ stubs. If it helps and makes sense to be in the library, just add it there. You can even get crazy and call as many C/C++ stubs as you want inside a C# method.
And that’s all! You can find all the code related with this blog post on a GitHub repository.
With all this I expect I was able to guide you through this very cool (and handy!) feature of .NETMF. Enjoy it!
The other day I was installing an update for a component and got a warning about low disk space on my development drive.
I went and checked that to find out that the disk was, in fact, almost full!
When going through the exercise of finding out what could be deleted I realized that the disk was filled with Gigabytes with Nuget packages on every Solution that had been built. Further to that I also found out that Nuget stores a nice cache of Nuget packages in the user home folder. Those were also taking up a serious amount of disk space.
Some housekeeping is definitely required on this matter! Manually going through all these is tedious and doesn’t work for me, so I decided that a Power Shell script should be able to do it for me.
So I came up with the script bellow that does the following:
Deletes all the Nuget packages in the users Nuget cache
Searches and deletes all the folders named ‘packages’ in the paths that are set in the script
Bellow the PowerShell script for doing that.
(because not all packages live under a single folder I covered the option to add multiple paths to be searched)
<# .SYNOPSIS Search and delete folders named 'packages'. .DESCRIPTION The script aims to help freeing up disk space taken by Nuget packages folders. When you build a project in VS it automatically downloads the required Nuget packages. Nuget also keeps a local cache of Nuget packages at the user folder. All this can take up a lot of disk space. You should set bellow the paths where to search for 'packages' folders. .EXAMPLE clean-nuget-packages.ps1 #>

# Nuget package repository at user folder
$nugetPackagesPath = Get-ChildItem -Path  ($HOME + '\.nuget\packages') -ErrorAction SilentlyContinue

# collection of paths that should be searched for folders named 'packages'
$pathsToSearch  = [System.Collections.ArrayList]@()

#############################################################################
# add bellow the paths that should be searched for folders named 'packages'
# mind the '\' at the end of the path
$pathsToSearch.Add('e:\github\') # this is the location of my GitHub local repository
$pathsToSearch.Add('e:\dev\') # this is the location of my TFS projects folder
#############################################################################

# delete packages in Nuget user's folder
foreach($path in $nugetPackagesPath)
{
    $path1 =  ($HOME + '\.nuget\packages\' + $path)
    Write-Host "Deleting " $path1
    Remove-Item ($HOME + '\.nuget\packages\' + $path) -force -Recurse
}

# search for folders named 'packages' in each path to be searched
foreach($path in $pathsToSearch)
{
    $pathsToDelete = Get-ChildItem -Path ($path + '*packages') -Filter 'packages' -Recurse -ErrorAction SilentlyContinue

    # now delete all paths that were found
    foreach($path in $pathsToDelete)
    {
        Write-Host "Deleting " $path
        Remove-Item $path -force -Recurse
    }
}
Feel free to copy the above script, use it and improve as you like!
The other day I was working on a PowerShell script that required some Regular Expressions to validate parameters.
RegEx is a very powerful tool with lots of uses, but I have to confess that I tend to struggle with the expression definition…
Apart from the expression definition it would be very interesting to be able to debug an expression, right?
I’ve stumbled on a truly awesome web tool that provides all that and even includes a library of common expressions. You can find it here.